A fun pop culture reference design with yellow circuit boards (similar to classification and/or neural network algorithm structures) and text.
The Ultimate Machine Learning Algorithm to Solve Any Problem is the One Algorithm To Rule Them All!
Tags:
algorithm, artificial intelligence, circuit, data merch, computer
A fun pop culture reference design with white circuit boards (similar to classification and/or neural network algorithm structures) and text.
The Ultimate Machine Learning Algorithm to Solve Any Problem is the One Algorithm To Rule Them All!
Tags:
algorithm, artificial intelligence, circuit, computer, data nerd
A fun pop culture reference design with black circuit boards (similar to classification and/or neural network algorithm structures) and text.
The Ultimate Machine Learning Algorithm to Solve Any Problem is the One Algorithm To Rule Them All!
Tags:
algorithm, artificial intelligence, circuit, computer, data nerd
A tongue-in-cheek humorous design poking fun at dashboard building and data visualization. The design includes "Who's Graphs is it Anyway?" surrounded by monochromatic blue maps, charts, graphs, pie charts, line charts and bar graphs. Ideal for those in computer science, data science, data analytics and related data nerd industries.
Tags:
funny data gifts, data visualization, humorous gift, pie chart, graphs
A humorous design proclaiming what the 3 Best Things in the World are, which is Cats, Coffee and Code as a computer scientist, developer, programmer, data scientist or data analyst. The words are accompanied by matching decorations such as cat whiskers, coffee beans as well as ones and zeros code.
Tags:
1s and 0s, computer, data, data analyst, data science
A humorous design proclaiming what the 3 Best Things in the World are, which is Cats, Coffee and Code as a computer scientist, developer, programmer, data scientist or data analyst. The words are accompanied by matching decorations such as cat whiskers, coffee beans as well as ones and zeros code.
Tags:
1s and 0s, computer, data, data science, developer
A design inspired by Superhero comics with a square panel and knockout speech bubble declaring "Show me the DATA!". The stars and text are coloured with a golden yellow for extra pop. Recommended shirt/clothing colours include Red, Blue, Teal, Purple and Green to complement the classic superhero colours.
A design inspired by Superhero comics with a square panel and knockout speech bubble declaring "Show me the DATA!". The stars and text are coloured with a golden yellow for extra pop. Recommended shirt/clothing colours include Red, Blue, Teal, Purple and Green to complement the classic superhero colours.
Tags:
data science, data analyst, speech bubble, science, computer
A design to illustrate your awesome amazing genius data science skills at work. Let other's know that you should not be disturbed while coding, programming, developing, troubleshooting or problem solving. Front and back printing.
Tags:
machine learning, programmer, science, developer, data scientist
A design to illustrate your awesome amazing genius data science skills at work. Let other's know that you should not be disturbed while coding, programming, developing, troubleshooting or problem solving. Front and back printing.
Tags:
artificial intelligence, big data, computer, data, data analyst
A humorous tongue-in-cheek design poking fun at the concept of deep fakes and the people who create them. It includes a blurred out anonymous profile with broken letters saying "DeepFakes: *are* No One, No Where, Everyone, Everywhere".
A humorous tongue-in-cheek design poking fun at the concept of deep fakes and the people who create them. It includes a blurred out anonymous profile with broken letters saying "DeepFakes: *are* No One, No Where, Everyone, Everywhere".
Tags:
data science, humour, machine learning, funny, neural network
A design inspired by ML models and science fiction. It includes a rocket ship powered by machine learning with a USB connector symbol, charging symbol and the flames/smoke is made up of data (ones and zeros).
Tags:
charging, space, big data, usb, artificial intelligence
A design inspired by ML models and science fiction. It includes a rocket ship powered by machine learning with a USB connector symbol, charging symbol and the flames/smoke is made up of data (ones and zeros).
Tags:
data science, big data, science fiction, computer code, ones and zeros
A design inspired by those funny things developers say when designing and programming new software or models. It includes the saying "It's not a bug, it's a feature" when quirky things occur in production/deployed apps. The design features googly eyes and a insect to boot. Ideal for those in computer science, data science, data analytics and related data nerd industries.
Data Science typography in Graffiti style filled with a gradient colour of spray paint to resemble street wall art. Enhance your data science swag.
Ideal for those in computer science, data science, data analytics and related data nerd industries.
Tags:
data analyst, data, computer programming, data scientist, computer scientist
Data Science typography in Graffiti style filled with a gradient colour of spray paint to resemble street wall art. Enhance your data science swag.
Ideal for those in computer science, data science, data analytics and related data nerd industries.
Tags:
artificial intelligence, cloud computing, computer programming, computer scientist, data
Data Science typography in Graffiti style filled with a gradient colour of spray paint to resemble street wall art. Enhance your data science swag.
Ideal for those in computer science, data science, data analytics and related data nerd industries.
Tags:
machine learning, developer, software engineer, programmer, data engineer
Data Science typography in Graffiti style filled with a gradient colour of spray paint to resemble street wall art. Enhance your data science swag.
Ideal for those in computer science, data science, data analytics and related data nerd industries.
A graphic design logo inspired by vintage/retro hipster logos and the periodic table of elements. The main feature is a venn diagram with icons and names of famous scientists that embrace the core aspects of data science. It includes the inventor (i.e., davincium); the subject matter expert (i.e., einsteinium); the improvisor (i.e., macguyvium); and finally the detective (i.e., sherlockium).
Tags:
data analytics, data solution engineer, multi tool, famous scientists, artificial intelligence
A graphic design logo inspired by vintage/retro hipster logos and the periodic table of elements. The main feature is a venn diagram with icons and names of famous scientists that embrace the core aspects of data science. It includes the inventor (i.e., davincium); the subject matter expert (i.e., einsteinium); the improvisor (i.e., macguyvium); and finally the detective (i.e., sherlockium).
Tags:
space, magnifying glass, rocket ship, data solution engineer, data analytics
A design inspired by all those annoying coding, programming, database, cloud computing errors that developer have to debug without knowing what went wrong. Ideal for those in computer science, data science, data analytics and related data nerd industries.
Tags:
artificial intelligence, data nerd, azure, data analyst, amazon
A design inspired by all those annoying coding, programming, database, cloud computing errors that developer have to debug without knowing what went wrong. Ideal for those in computer science, data science, data analytics and related data nerd industries.
A design inspired by harmonographs and Lissajous curves that create geometric images using pendulums and harmonic motion. The harmonograph was created using an algorithm and specially created data in R using ggplot2. The harmonogram was colored with a watercolour palette of Yellow, Purple, Blue and Green. Additional glitter-like highlights were added for more interest. Ideal for those working in the following industries: STEM, Science, Data Science, Machine Learning, Artificial Intelligence, Big Data, Computer Science, Information Technology, Business Analytics, Business Intelligence.
Tags:
abstract, big data, data, geometric, machine learning
A design inspired by the vibrant colours of mosaic artworks. Created with specially generated data in R studio coded by me from scratch using polygon algorithms for the pentagon geometric shapes. Generated in the (1) Viridis, (2) Inferno and (3) Plasma color palettes of ggplot2; perceptually uniform shades of (1) blue, yellow, green (2) black, red, yellow and (3) blue, red, yellow.
Ideal for those working in the following data nerd industries: STEM, Science, Data Science, Machine Learning, Artificial Intelligence, Big Data, Computer Science, Information Technology, Business Analytics, Business Intelligence.
Tags:
big data, computer, computer science engineer, data, data analyst
A design inspired by harmonographs and Lissajous curves that create geometric images using pendulums and harmonic motion. The harmonograph was created using an algorithm and specially created data in R using ggplot2. The harmonogram was colored with a palette of Yellow, Orange, Purple and Green.
Ideal for those working in the following industries: STEM, Science, Data Science, Machine Learning, Artificial Intelligence, Big Data, Computer Science, Information Technology, Business Analytics, Business Intelligence.
A design inspired by the beauty and intrigue of kaleidoscopes. The design was created with randomly created generated data in R. Afterwards a kaleidoscope algorithm was applied at 30 degrees with 6 polygon points.
Tags:
gifts for data analysts, data science, geometric shape, inferno, mandala
A 5 point Maurer rose artwork created with R software programming code. Generated from scratch with specially created data and colored by hand with abstract shapes.
A 5 point Maurer rose artwork created with R software programming code. Generated from scratch with specially created data and colored by hand with abstract shapes.
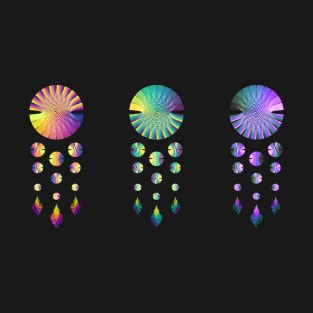
A design inspired by dream catchers. These Data Catchers were created with randomly generated data in R studio using Chord diagrams and Branching dendograms.
Tags:
data visualization, code art, computer, computer scientist, abstract
A design inspired by dream catchers. These Data Catchers were created with randomly generated data in R studio using Chord diagrams and Branching dendograms.
Tags:
data analyst, data art, data nerd, abstract, data scientist
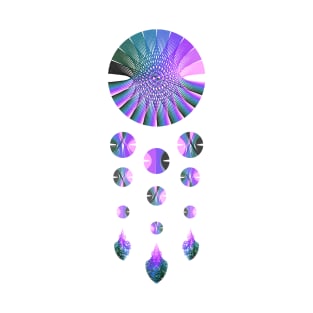
A design inspired by dream catchers. This is a Data Catcher created with randomly generated data in R studio using Chord diagrams and Branching dendograms.
Tags:
data visualization, big data, math art, algorithmic art, data analytics
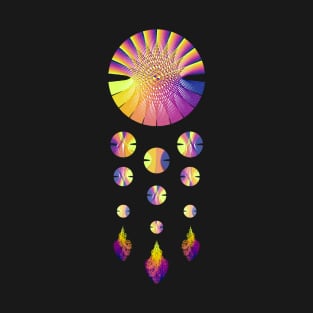
A design inspired by dream catchers. This is a Data Catcher created with randomly generated data in R studio using Chord diagrams and Branching dendograms.
Tags:
science, math art, data scientist, generative art, code art
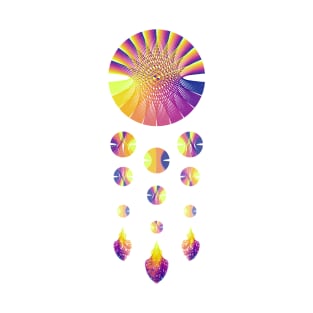
A design inspired by dream catchers. This is a Data Catcher created with randomly generated data in R studio using Chord diagrams and Branching dendograms.
Tags:
computer, big data, data analyst, data, data scientist
A design inspired by dream catchers. This is a Data Catcher created with randomly generated data in R studio using Chord diagrams and Branching dendograms.
Tags:
generative art, science, math art, data, data analyst