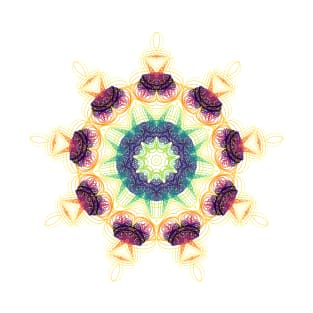
A design inspired by kaleidoscopes and harmonographs. The harmonographs were created using an algorithm and specially created data in R using ggplot2. The harmonographs were arranged into an 9 point polygon at 42 degrees.
A design inspired by kaleidoscopes and harmonographs. The harmonographs were created using an algorithm and specially created data in R using ggplot2. The harmonographs were arranged into an 9 point polygon at 42 degrees.
A design inspired by kaleidoscopes and harmonographs arranged in a lotus flower. The harmonographs were created using an algorithm and specially created data in R using ggplot2. The harmonographs were arranged into an 6 point polygon at 36 degrees.
Tags:
gifts for data scientists, rainbow, data analytics, geometric, mandala
A design inspired by kaleidoscopes and harmonographs arranged in a lotus flower. The harmonographs were created using an algorithm and specially created data in R using ggplot2. The harmonographs were arranged into an 6 point polygon at 36 degrees.
Tags:
gifts for data analysts, rainbow, harmonogram, abstract, oragami
A design inspired by kaleidoscopes and harmonographs. The harmonographs were created using an algorithm and specially created data in R using ggplot2. The harmonographs were arranged into an 6 point polygon at 36 degrees.
Tags:
gifts for data analysts, abstract, data science, geometric, glow
A design inspired by kaleidoscopes and harmonographs. The harmonographs were created using an algorithm and specially created data in R using ggplot2. The harmonographs were arranged into an 6 point polygon at 36 degrees.
Tags:
gifts for data scientists, abstract, data science, geometric, glow
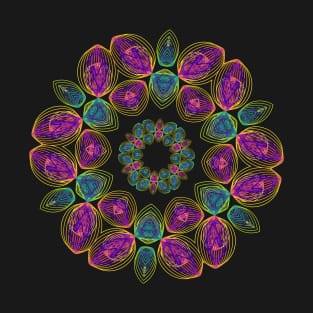
A design inspired by kaleidoscopes and harmonographs. The harmonographs were created using an algorithm and specially created data in R using ggplot2. The harmonographs were arranged into an 6 point polygon at 36 degrees, perpetually shaded colours of Green Pink Yellow on a black background.
Tags:
gifts for data scientists, abstract, angel wings, butterflies, data science
A design inspired by kaleidoscopes and harmonographs. The harmonographs were created using an algorithm and specially created data in R using ggplot2. The harmonographs were arranged into an 6 point polygon at 36 degrees, perpetually shaded colours of Green Pink Yellow on a white background.
Tags:
gifts for data analysts, abstract, angel wings, butterflies, crown
A kaleidoscope design inspired by the beauty and symmetry of Rose Curves arranged into an 11 point polygon at 45 degrees.
In mathematics, a rose or rhodonea curve is a sinusoid plotted in polar coordinates.
The curves were created with polygon density plots and specially generated data in R.
The colours were created with the Viridis, Plasma and Inferno colour palettes in perpetual shades of blue green yellow, blue red yellow and black red yellow respectively.
Tags:
gifts for data analysts, algorithmic art, flowers, generative art, geometric
A kaleidoscope design inspired by the beauty and symmetry of Rose Curves. In mathematics, a rose or rhodonea curve is a sinusoid plotted in polar coordinates. The curves were created with polygon density plots and specially generated data in R. The colours were created with the Viridis, Plasma and Inferno colour palettes in perpetual shades of blue green yellow, blue red yellow and black red yellow respectively.
Tags:
algorithmic art, flowers, generative art, geometric, gifts for scientists
A design inspired by the beauty and intrigue of kaleidoscopes. The design was created with randomly created generated data in R in the Nebula color palette, perpetually uniform shades of blue green pink on a black background.
Afterwards a kaleidoscope algorithm was applied at 45 degrees with 9 polygon points.
Tags:
gifts for data scientists, data science, geometric shape, mandala, map
A design inspired by the beauty and intrigue of kaleidoscopes. The design was created with randomly created generated data in R in the Plasma color palette, perpetual uniform shades of blue red yellow.
Afterwards a kaleidoscope algorithm was applied at 30 degrees with 6 polygon points.
Tags:
data science, geometric shape, gifts for scientists, mandala, mosaic
A design inspired by the beauty and intrigue of kaleidoscopes. The design was created with randomly created generated data in R in the Viridis color palette, perpetual uniform shades of blue green yellow.
Afterwards a kaleidoscope algorithm was applied at 30 degrees with 6 polygon points.
Tags:
data science, geometric shape, mandala, mosaic, optical illusion
A collection of phyllotactic spirals inspired by the arrangement of leaves on a plant stem. Each spiral was generated with individual points using R code. Afterwards a kaleidoscope algorithm was applied at 36 degrees with 6 polygon points.
Tags:
gifts for data scientists, data science, geometric shape, mandala, neon
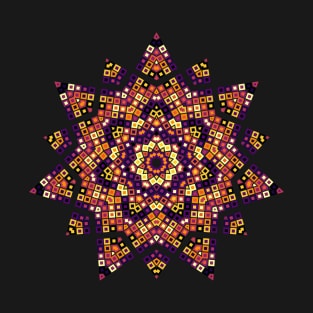
A design inspired by the beauty and intrigue of kaleidoscopes. The design was created with randomly created generated data in R in the Inferno color palette, perpetual shades of black red yellow. Afterwards a kaleidoscope algorithm was applied at 30 degrees with 6 polygon points.
Tags:
gifts for data analysts, data science, geometric shape, inferno, mandala